Motivation/context
I was interested in figuring out an ultra-cheap way to transform my IKEA table to a touch screen or some sort of user interface. Figuring out the position of the table where a tap happens is the first step to doing that. This is the problem of acoustic source localization.
Normally to localize an acoustic source, one needs synchronous recordings from multiple channels. For the case of impulse excitations in particular (percussive excitations - something hitting the thing), it is easy to localize the source when one can simultaneously read multiple channels. One may simply compute a triangulation for the first time of arrival of the elastic wave.
On the other hand, depending on the damping characteristics, it could be tough to localize the source in a 2D plate if recordings from multiple sensors do not exist. Reverberations on the boundaries are hard to model precisely and are treated as a nuisance in applications.
An additional motivation for this project is that I’m working with DenseNets with dilated convolutions (link to my work) lately. The DenseNet is a particular type of convolutional neural network with shortcut connections from all layers to all layers. I wanted a controlled, non-trivial dataset to test a DenseNet with an architecture similar to the one I’m using for the other problem.
See also my informal presentation for our lunch group meeting on the topic where I explain more details behind the project.
The math background
There is a theory called compressive sensing that states that when we have a signal that consists of some components mixed in an unknown way, we can fully recover it if we sample in a smart way and beat classical bounds on sampling frequency (Nyquist frequency) for fully recovering the signal. Namely, the trick is to replace regular sampling with randomized sampling. One important consequence of this the theory is that if you get a signal that consists of signals of some sensors that has been multiplied and shifted in any way that is different for each sensor, you can fully recover and separate the original signals. The simplest example of why compressive sensing works that come to mind is related to the simplest construction of an invertible matrix. Namely, an invertible matrix can be created by simply filling a matrix with random values. It’s extremely unlikely that you get a non-invertible random matrix if you don’t impose some more structure. We impose such a structure with regular sampling. We can destroy it by non-regular sampling.
This theory became quite fashionable in the signal analysis community after some impressive results with a single-pixel camera .
Elastodynamics of plates and a simple compressive electric circuit:
How does compressive sensing come into play when finding the excited eigenmodes of a structure? It is easier to think of a string:
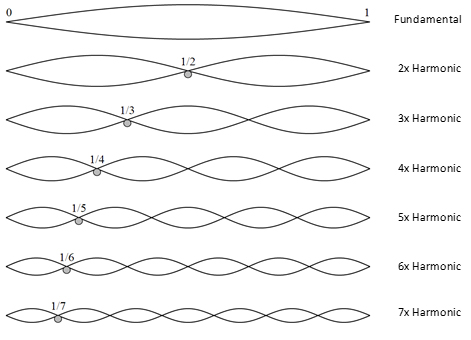
Say we want to get the precise reconstruction of the vibration of a string. And we have three sensors. If the string is excited in its 3rd harmonic and we place the sensors on the nodes of the 3rd harmonic (the places that there is no displacement when the harmonic is excited) we will be able to sense - literally - nothing! Note also that all multiples of the 3rd harmonic are lost (for example, the nodes of the 6th harmonic are also nodes of the 3rd harmonic). If we randomly place the sensors on the string. It is extremely unlikely that they will end up all on nodes of harmonics, so we’ll always sense a mixture of modes. Of course, an arbitrary excitation is going to be a mixture of several harmonics, each one contributing with a different factor.
For a related reason, square or generally symmetric rooms are bad for listening to music or playing music. There are “modes” of the air in the room that are not well excited and others that are overexcited, and the audience can’t listen correctly to the overtones of the instrument (audience hears “the room” as well in some sense).
In two dimensions, a similar situation arises. Random sensor placement is optimal sensor placement in a certain sense! It is most probable to get incoherent measurements if one employs randomly placed sensors. If one places sensors in a symmetric manner on a symmetric structure, it is highly likely that information will be lost.
The actual single-channel 2D impulse locator:
The purpose of this project is not to fully reconstruct the signal from multiple sensors. Some simple integrating hardware that returns a 1D representation of the signal from several sensors is needed, which is expected to be unique depending on the dynamics excited by the “tap” due to the absence of symmetry in the structure. The elastodynamics of a plate, together with the dynamics of electrical charges on a circuit, could achieve that. Finally, an algorithm is needed that can automatically identify the signal and use the signal for localization, learning features directly from data. The integrated 1D signal from all sensors should non-trivially affect the mixed 1D signal in a way that it can be exploited in the localization task. The simplest possible integrator is an analog integrator - i.e., a capacitor. The sensor of choice is piezoelectric disks. Piezoelectric disks are capacitors themselves, so they are ideal for the application. Therefore the compressive sensing “device” is the sensor itself. The focus of compressive sensing seems to be on random digital integrators - the approach I used is an alternative and much simpler one. If a set of strain sensors were used, a capacitor would still be needed in order to mix the signal through some dynamics induced by the electrical circuit.
It should be noted that the piezos are not precisely passive components. Piezo-disks do act as capacitors, which is a passive component, but they also actively create a charge when they are excited. This charge is either neutralized locally due to leakage in the piezo or becomes current in a closed circuit connected to the capacitor. When we use piezos as sensors, we take advantage of the latter. The application herein aims to take advantage of both the active and passive properties of the piezos. Finally, since piezo-disks are transducers they deform under charge, but this is not expected to occur except if there is some amplification (using the piezos as speakers). Piezos are often used as ultra-cheap speakers for appliances. If you have a home appliance that creates a high-pitched sound, it probably uses a piezoelectric disk. Piezoelectric components are often used as active sensing components - one may use them to excite your structure as well. The well-known application of that is ultrasound imaging. The ultrasound probe contains an array of piezoelectric components that send a high-pitched elastic signal (in the ultrasound range) and they sense it when it gets reflected. By some phasing tricks, the tomographic information of the underlying tissue is relatively easy to reconstruct with appropriate hardware. Check the Wikipedia on phased arrays if you want to know more.. The approach taken in this project is orthogonal to phased array sensing. By the way, the idea of using compressive sensing for cheaper ultrasound machines has already been used! Here is a link to this interesting research.
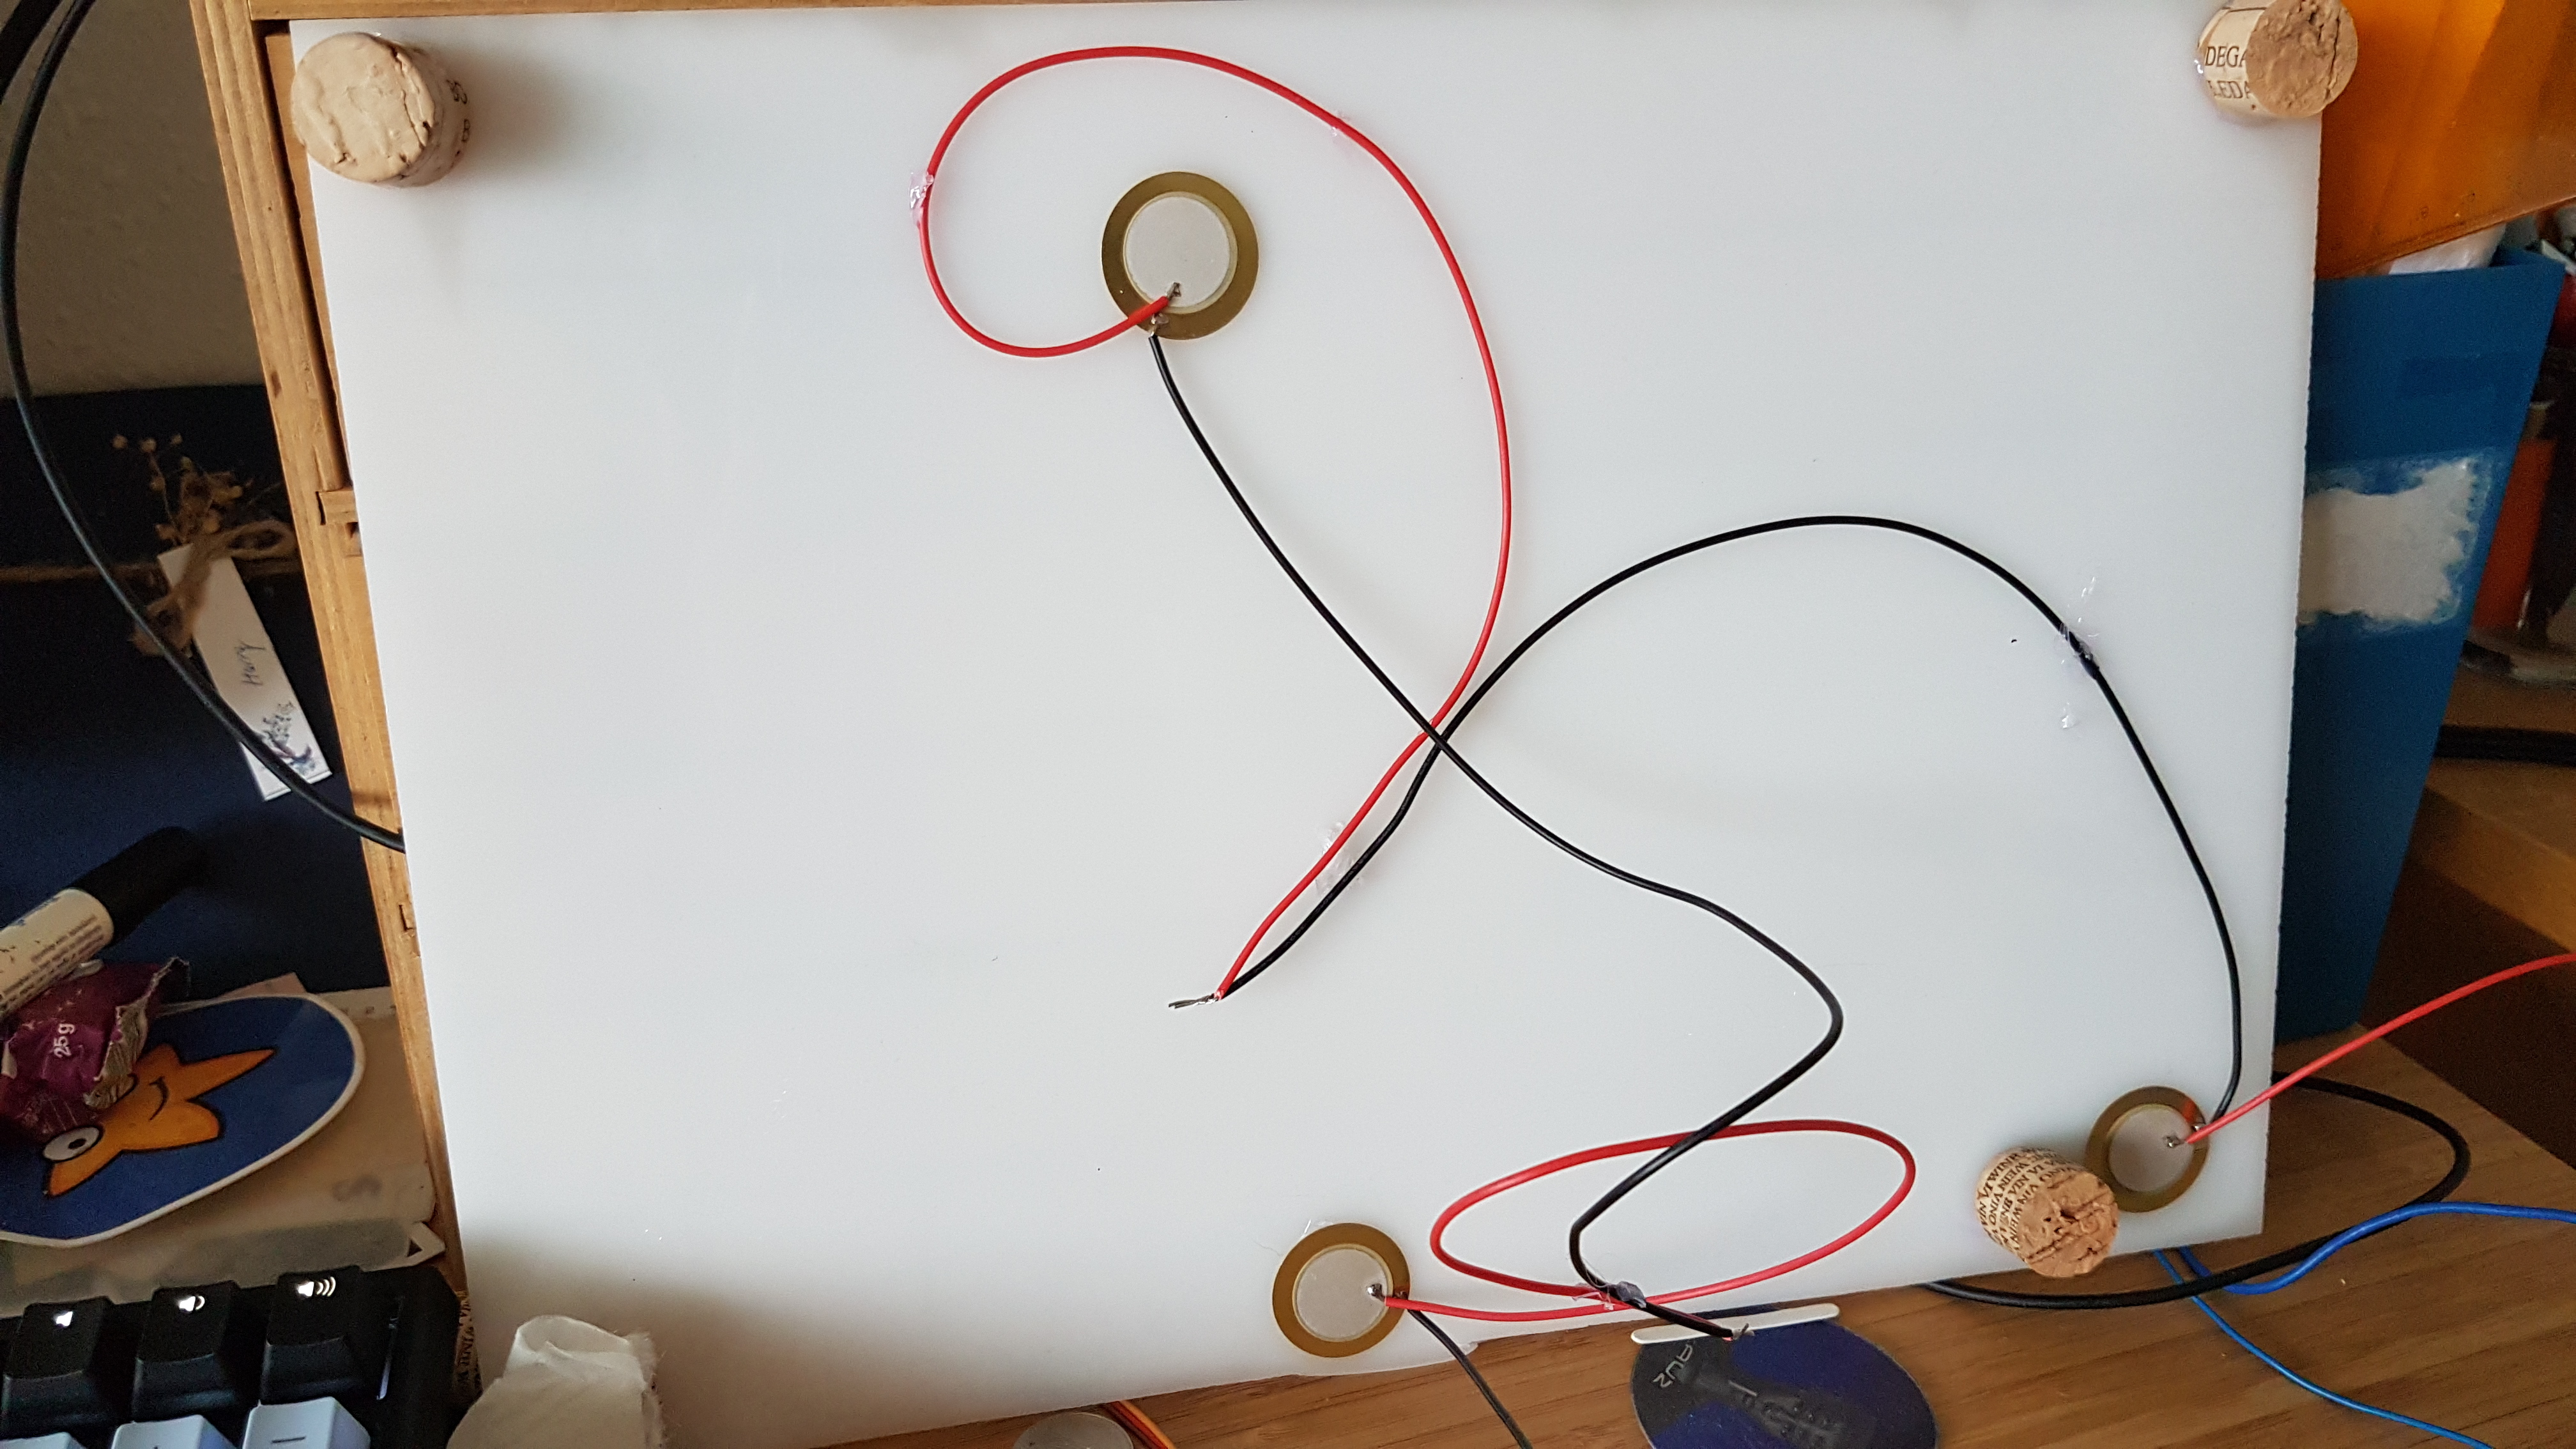
In my experiment, I have an acrylic plate with three piezoelectric sensors connected in series, supported with hot glue (see picture). The sensors were connected in series because I want them to develop some recharging/uncharging dynamics in tandem with the dynamics of the plate. This would not be possible in parallel since the charge would simply sink to the soundcard. Note also that I purposely do not put them in regular positions. Also, the support of the plate (the corks I hot-glued) is non-symmetric. I tap the plate with a plastic pen, and I record the mixed signal in a single channel. The signal is expected to be unique for each tap location due to the coupled elastodynamics and electrodynamics of the piezos.
Here is a bottom view of the plate.
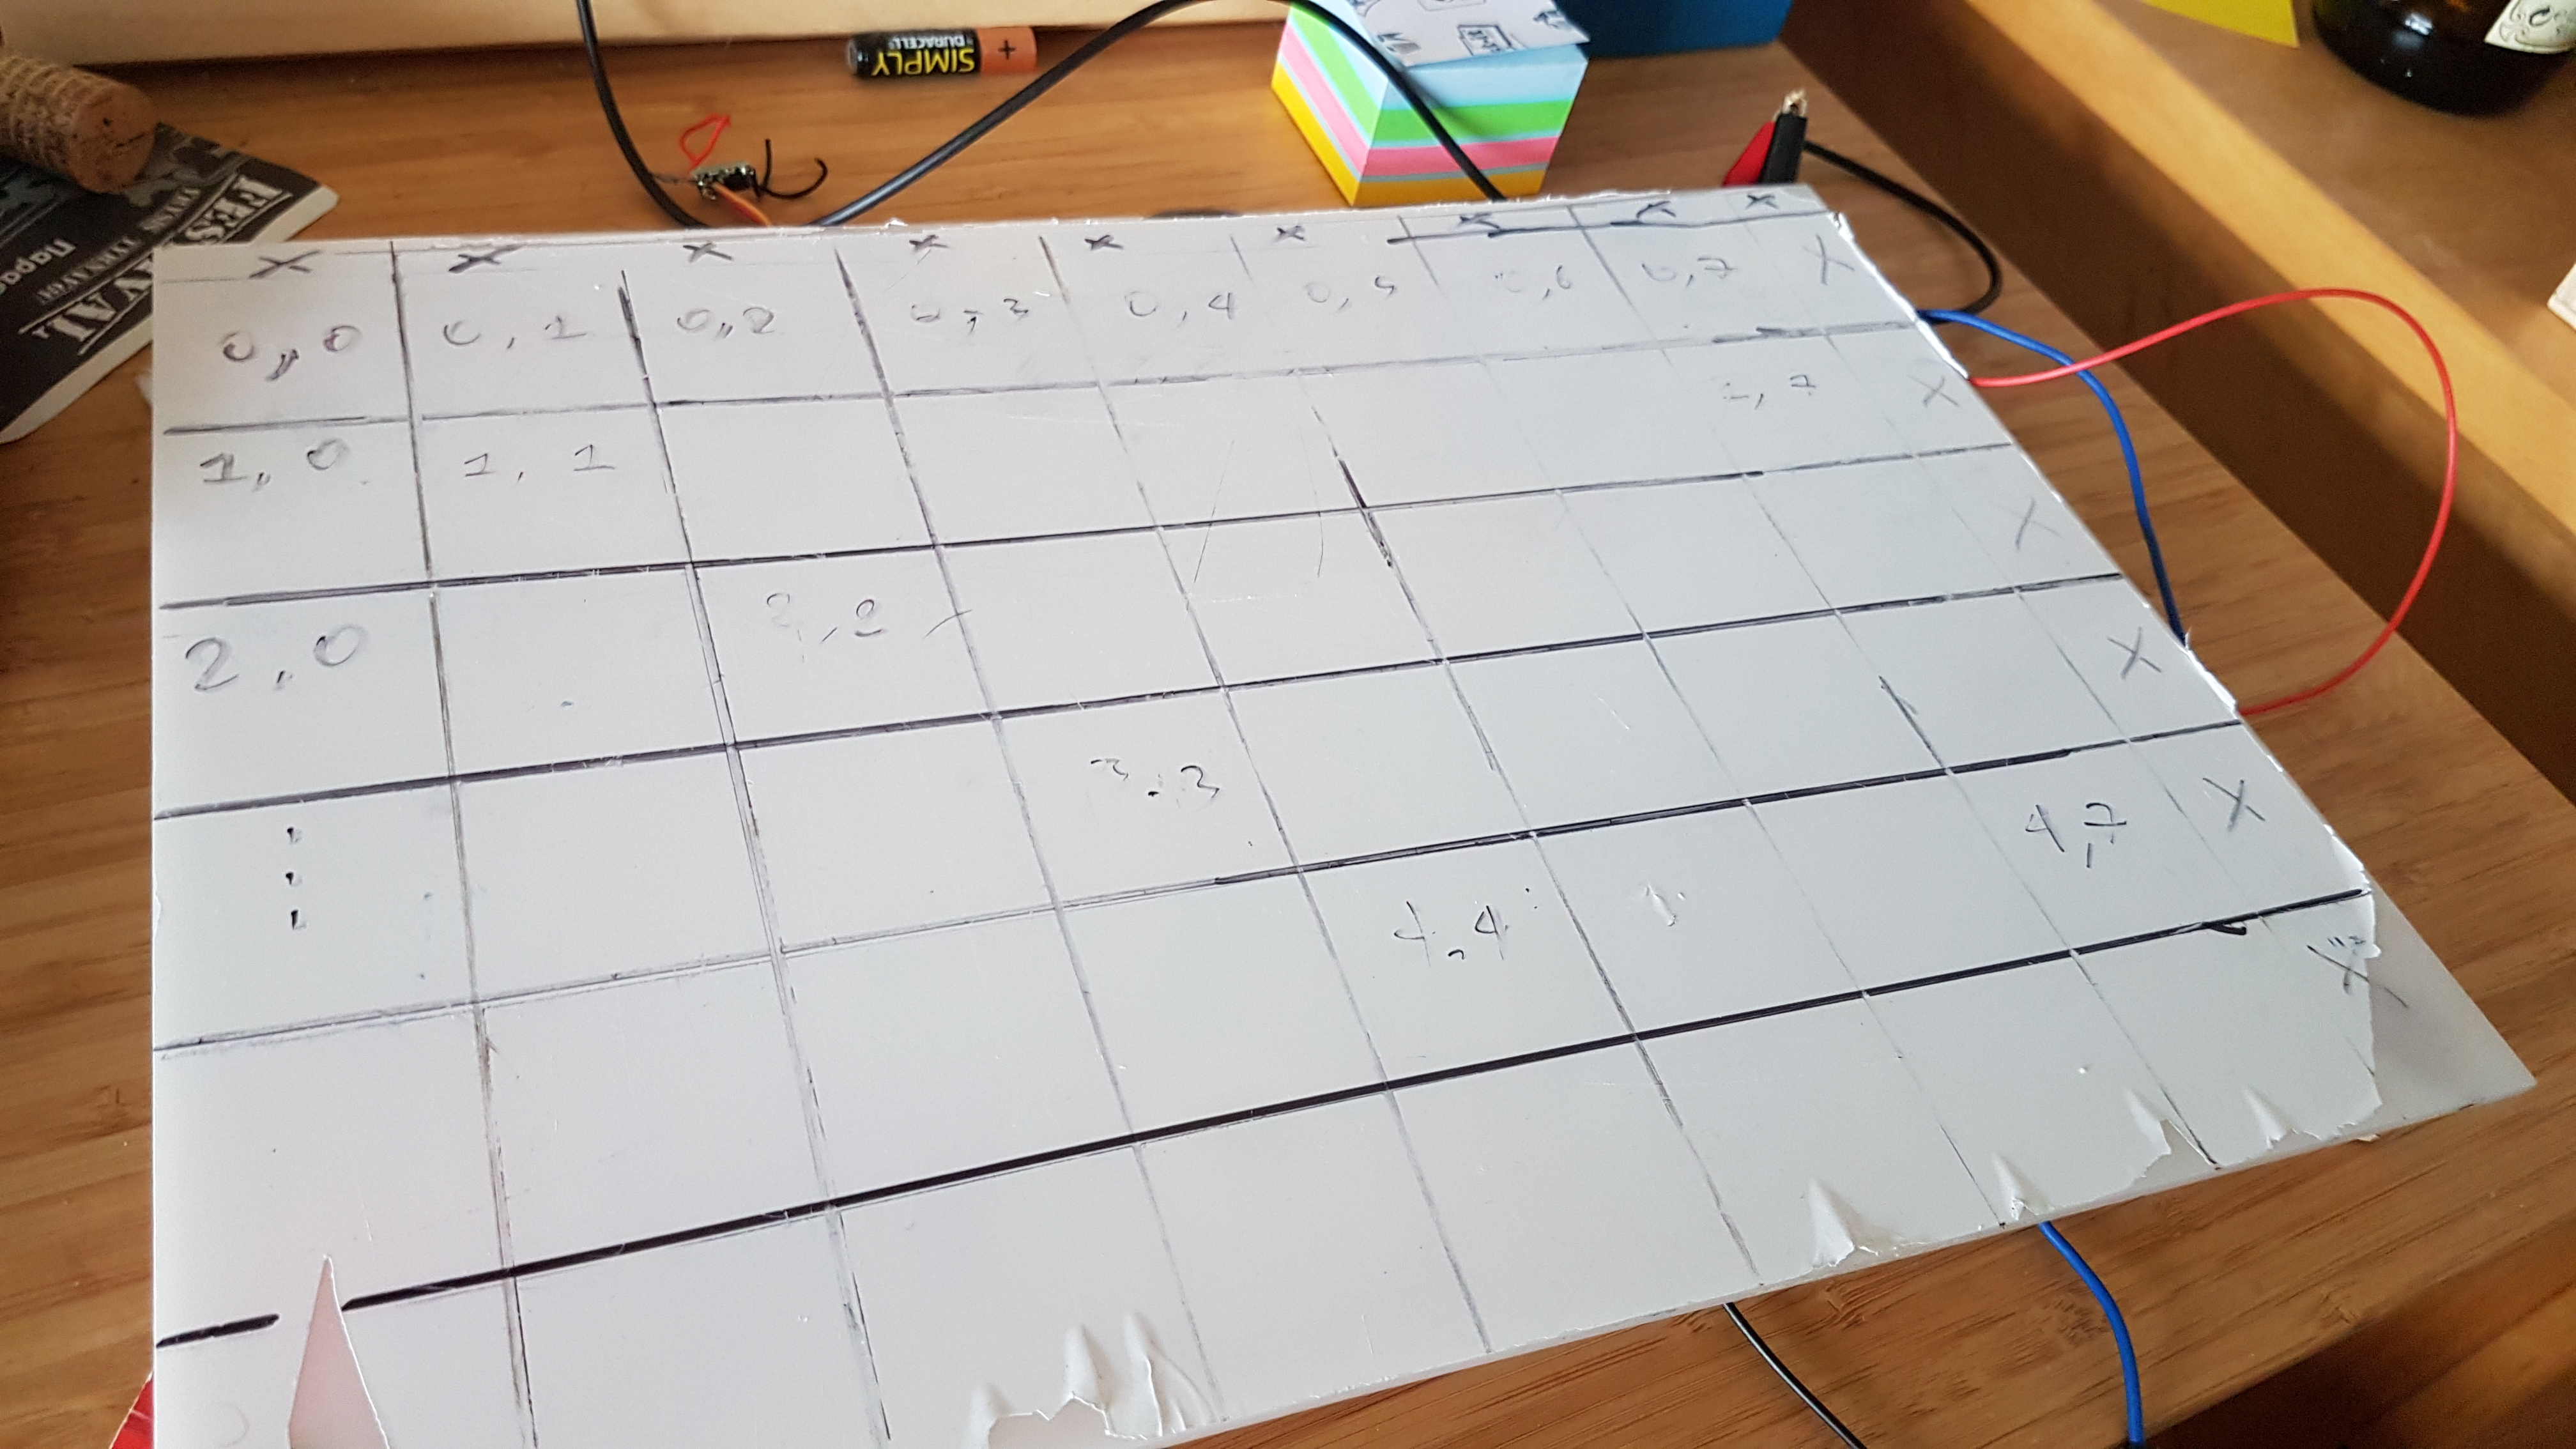
And a top view, where I sketched a 5x8 grid.
Excitation and pre-processing
So with some patience, I managed to collect more than 2k taps on this plate. I tap the boxes in series from 0,0 to 4,7, always in the same order. Initially, I was recording with Audacity, and I had created a python script that identifies the peaks of the taps and assigns them to the correct box by the order that the taps came. I soon switched to a simple recording script in python, which gave feedback on the correct taps. The frames are aligned around the peak of each individual tap. Namely, 1k samples before the peak and 3k samples after the peak are kept for each segment.
After collecting the taps, some first encouraging results with PCA were observed. Namely, while plotting the distribution of the PCA components for each box, we see that there are some patterns emerging that indeed seem to fingerprint the excitation position. If there were no unique dynamics for each tap, the plots of the PCA components at different tap positions would look similar. It seems that even a linear classifier could give some decent results for this problem after all.
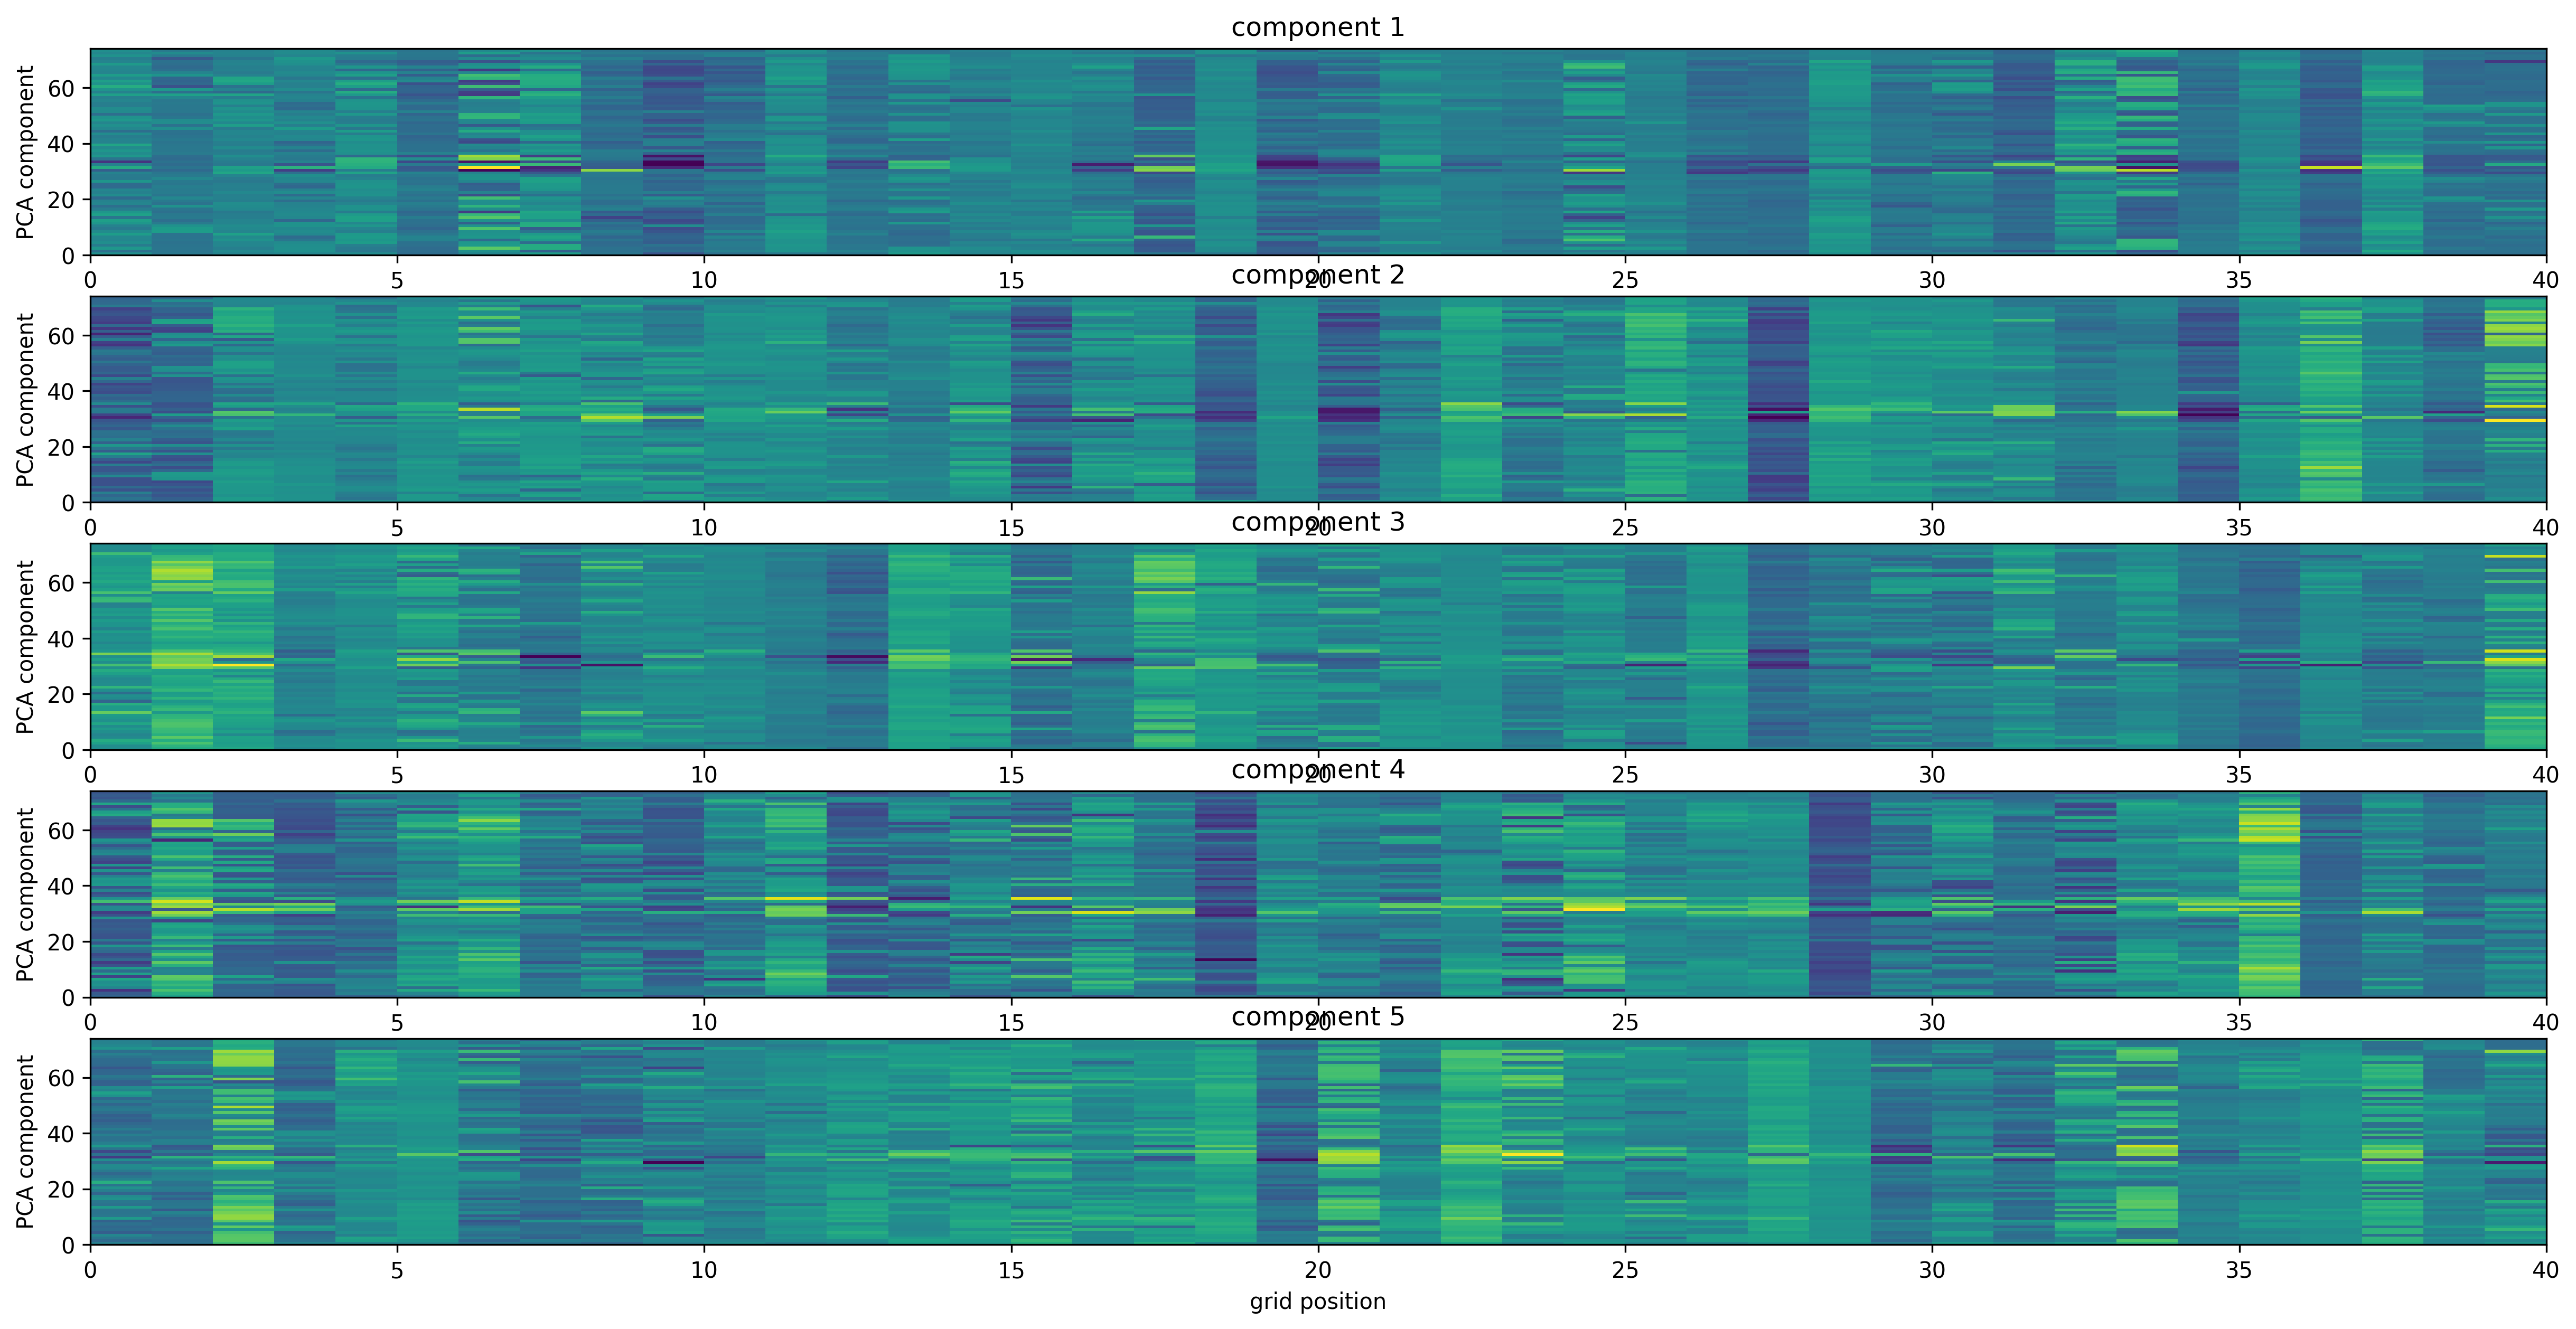
The effect of noise is quite pronounced, but it is for sure not masking the variation of the components. The components themselves, when plotted in time, did not have any interesting feature I could manually interpret.
The different rows of each matrix plot correspond to different independent measurements. In my reading of the plot, PCA analysis captured some variations that have to do with the variation that I wanted to capture in the first place. Namely, the localization info - whether there is something in the signal that is unique at each tap location due to the system dynamics.
DenseNet for localization
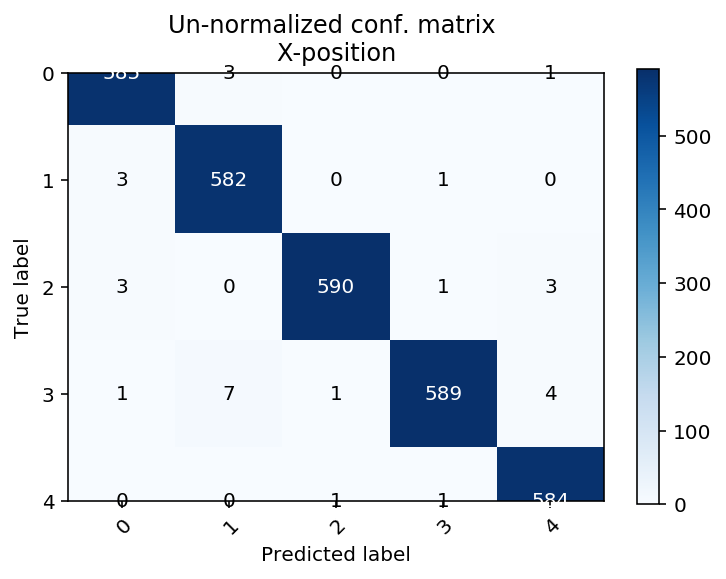
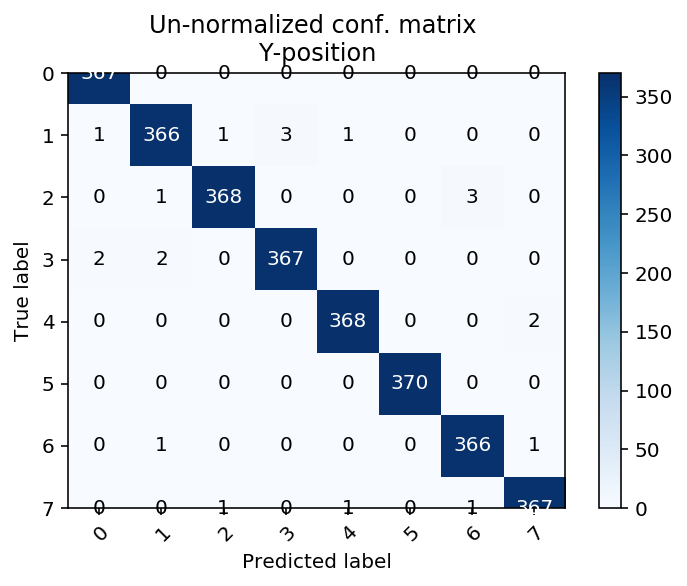
I used a simple DenseNet model with five layers of filters of size 10, with relus and dilations of size 2. I made a loss function that classified the x and y position separately. Almost to my surprise, the network performed really well on the first try. Raw high-frequency audio signals were fed into the network - no FFT or wavelet processing (or featurizing) and no denoising.
Here are the confusion matrices on the whole set. I used a training set of around 2k samples and 500 samples as a validation set, with sampling for validation set stratified by tap position (5x8 = 40 strata). Here are the confusion matrices for the whole dataset:
Running the model
A python script was written to evaluate the model in real-time. The model for real data gives an accuracy of approximately 75%. Further improvements would be possible with a better model and of course, more data.
Scaling to IKEA table
I have implemented the same method to an IKEA table. The network performed relatively well - also in real-time. Data collection etc, is not very easy, and the cables under my table do not look very good, so after making this work, I abandoned this project.
Conclusions
Both the theory that motivated this and the implementation could have been simpler. First of all, it makes sense that a forced vibration has a unique linear-modal signature. In that sense, any not completely symmetric structure can be used as a structural/electrical (or “electromechanical”) compressed sensing device. The key idea is that incoherent measurements and a downstream algorithm to make sense of the incoming data are enough for this to work. I believe deep learning has a lot to offer on applications of this sort.
It’s difficult to model exactly how the structure is excited, but one does not really need to model at all how it is excited to perform the downstream task of localization. Actually, it may not be so obvious from the presentation of the results here, but PCA gives quite decent results, and a simple softmax on the PCA coefficients would also have given decent results!
Deep neural networks can easily handle the task of figuring out useful features for acoustic localization. This may have applications on indoor localization (for instance, for localizing robot vacuum cleaners or for occupancy detection). It is not clear if indeed the dynamics of the multi-sensor circuit are captured or simply some excitation-dependent reverberations are captured. The latter is still interesting, and it still works due to the same theory. Visually there was some discernible difference between the impulses, mostly on the low amplitude part of the wave.
I hope you enjoyed this! Harry